
Rolling Planning: The Implementation Guide
How CIOs and digital leaders manage their IT organizations, build trust, and become drivers of transformation.
Authors Svenja Lang · Dr. Tamara Leuthe · Vincent Jaenisch
From Unrealistic Planning to Reliable Delivery
Resources, dependencies, and consequences clearly visible at all times.
More Trust, Better Decisions
Shaping the future together with the business units; data-driven rather than emotionally.
Scalable IT, Successful Transformation, Sustainable Business Success
A rolling planning principle.
Foreword
The Purpose of This Guideline
We firmly believe that companies must transform today to remain competitive or to regain their competitive edge. To make that happen, IT organizations need to be more deeply embedded in the business models than ever before.
For this transformation to succeed, it is not enough to change business operations. The IT organization itself must also transform fundamentally: in its role, how it works, and in how it collaborates with the rest of the company.
This is exactly where many companies fail. Not because strategies are lacking, but because business and IT do not share responsibility for priorities, capacities, and trade-offs. As a result, IT becomes a bottleneck.
Yet the opposite should be the case: IT should not be a bottleneck, but an active driver of digital transformation—helping to shape and make decisions by working closely with the business units.
This guide is intended for CIOs and IT executives who share this conviction and are ready to act on it. For those who no longer see IT as a purely operational function, but as a strategic partner that co-leads transformation.
It is aimed at those who are ready to
- make conflicts and bottlenecks visible rather than working around them operationally,
- establish and demand shared responsibility with business operations,
- honestly assess feasibility—with the courage to prioritize clearly.
The guide shows how rolling planning makes this collaboration possible:
- It describes how simplified structures and decentralized accountability create transparency over capacity and costs—and reveal where bottlenecks actually occur.
- It shows how clear accountability between business operations and IT enables shared prioritization across silos—working together, not against each other.
- It clarifies how major transformation topics such as sourcing decisions, reprioritization, or restructuring can be designed to provide direction, build acceptance, and strengthen the organization in the long term—rather than overwhelming or paralyzing it.
This guide is deliberately concrete rather than abstract. It is grounded in hands-on experience, proven frameworks, and deep practical knowledge—designed to integrate naturally into the day-to-day reality of an IT organization.
This guide is not a "business as usual" approach. It calls for decisions. – Are you ready for that?
Why Rolling Planning?
The world is not becoming more predictable. Terms like "VUCA" and "Never Normal" have become part of everyday business language for a reason (Bennett, Lemoine, 2014). For CIOs, this means that IT organizations must be able to respond quickly to change.
Yet according to Gartner (2024), only about one in five IT organizations is actually effective at capacity planning; meaning they can reliably deliver and maintain strong employee engagement. On top of that, IT projects on average exceed their initial budget estimates by 45%. Most IT organizations simply can't deliver reliably. Not because their people aren't capable, but because they lack effective capacity and cost management, and the organizational engagement to back it up. Plans are revised mid-year without warning, and even those revisions do not happen fast enough to respond to shifts in the market. This is exactly where rolling planning makes the difference.
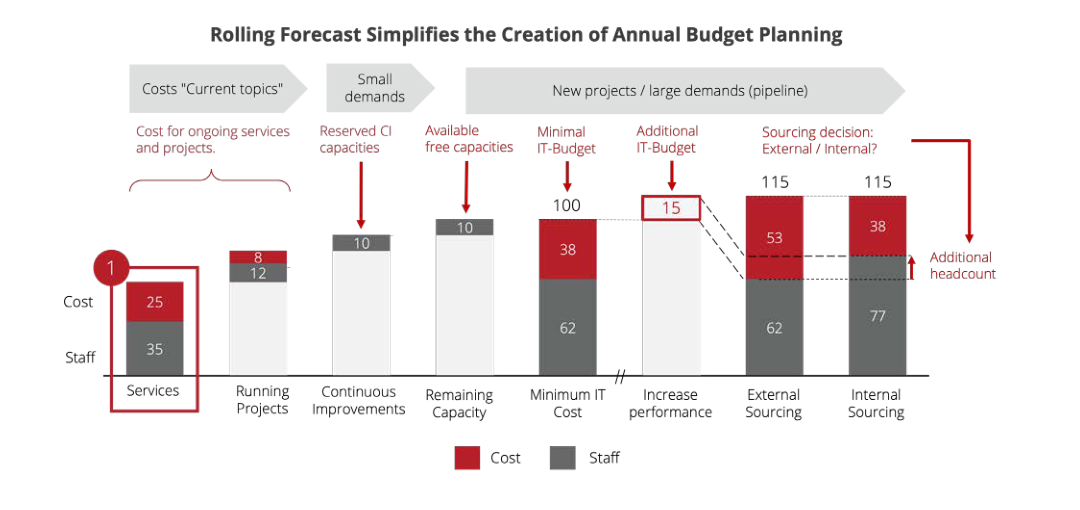
Rolling planning refers to the ongoing annual planning of expenses, external costs, and investments – not just once at the start of the year. Instead, it is regularly reviewed, adjusted, and updated, based on changes in projects, market conditions, and emerging requirements (see figure). To address these changes, a strategic buffer is required to build up or scale back capacities as needed, i.e., a clear sourcing strategy: knowing which competencies are so critical to the company's success that they must remain in-house, and which services can be sourced externally in a more flexible or cost-effective manner.1 Here, too, rolling planning consistently delivers transparency.
The following chapters are not about doing more planning, they are about steering better. We will show you how to create transparency without adding overhead, and how to build reliability, focus, and a real partnership between business operations and IT.
Because transformation can only truly succeed when priorities are aligned.
1 In fact, business unit and business function leaders surveyed by Gartner (2024) stated that they have to adjust at least half of their business plans during the course of the year in order to keep pace with the speed of change.
From the Paper Map to Online Navigation: An Analogy for Rolling Planning
Maturity Level 1: The Paper Map
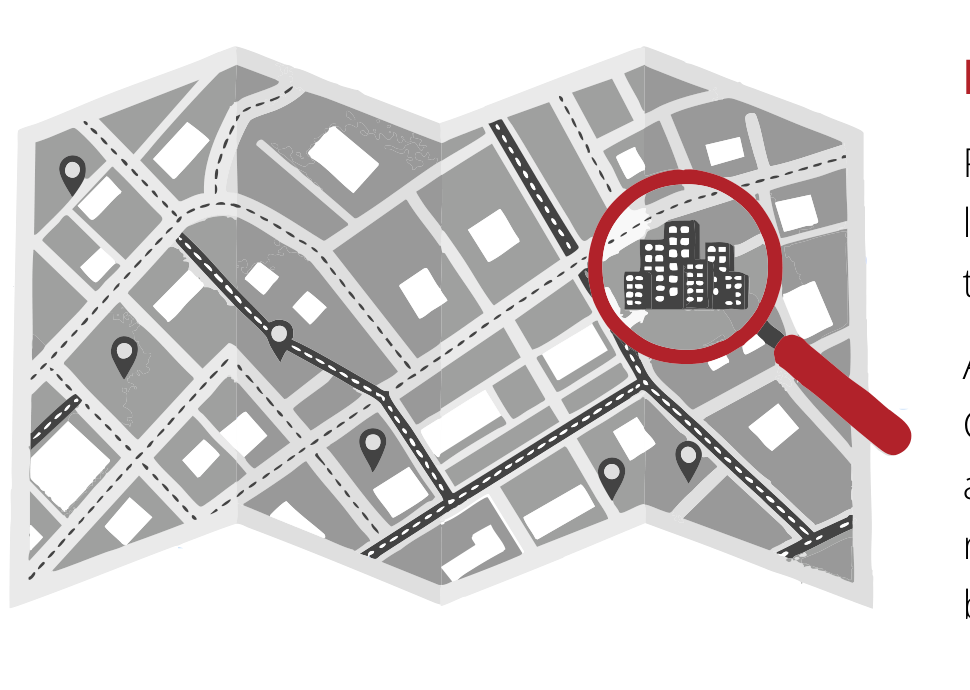
Perhaps you still remember road trips with a good old paper map: no live location, no traffic updates, no alternate routes, no reliable arrival time. Just uncertainty — and plenty of friction in the car.
At the lowest maturity level, IT planning works exactly the same way. Goals are set once a year, budgets are allocated, projects are launched, and then everyone hopes the plans will work out. Course-correcting requires significant effort, because the visibility into actual status has to be recreated from scratch every time.

Maturity Level 2: The Radar
A radar offers a bit more comfort. You can see where things are — but only in intervals. The moment the beam sweeps over an object, its position briefly lights up. Then it fades again until the next pass. Between scans, uncertainty quietly grows.
This is how many IT organizations operate today. Actuals are compared to plan values at intervals (in the worst case, annually). Deviations become visible, but only at snapshots in time. What changed between two reporting cycles stays in the dark. When the environment shifts, there are no alternatives, and there is no real-time picture.

Maturity Level 3: Online Navigation (GPS)
Today, live GPS navigation is the standard. Real-time traffic data ensures that you always take the best route under the given conditions. If obstacles arise, the system makes them visible early and shows you the best alternative right now. If priorities or goals change along the way, the system adjusts immediately. This is the principle of rolling planning.
In the pages ahead, we will show you what this might look like for your organization, how to make it happen, and why the effort is worth it.
Keep the transformation from a paper map to online navigation in mind as a helpful visual. It will guide you through this document to illustrate rolling planning.

1
Making Org Structures and Internal Capacities Visible
Navigation Analogy: Getting Familiar with the Parameters
Every journey begins with three parameters: Where am I? What resources do I have at my disposal? And where are the bottlenecks that limit my options from the outset? If you are unaware of this reality, you are not steering; you are merely hoping.
What is the IT Organization's Capacity for Action?
Before we discuss priorities, initiatives, or transformation together, we work with our clients to clarify how much capacity the IT organization has and how it is distributed.
Net Capacity as a Shared Baseline
In this first phase, we work directly with our clients to determine a realistic net capacity for operational activities for all employees. We systematically account for:
- Vacation days and average sick days
- Adjustment factors for administrative and leadership responsibilities
- Differences by role and seniority level
The resulting net capacity forms a shared, reliable baseline. It not only serves as the foundation for ongoing capacity and resource management, but also as the basis for calculating cost center rates and internal cost allocations down the line.
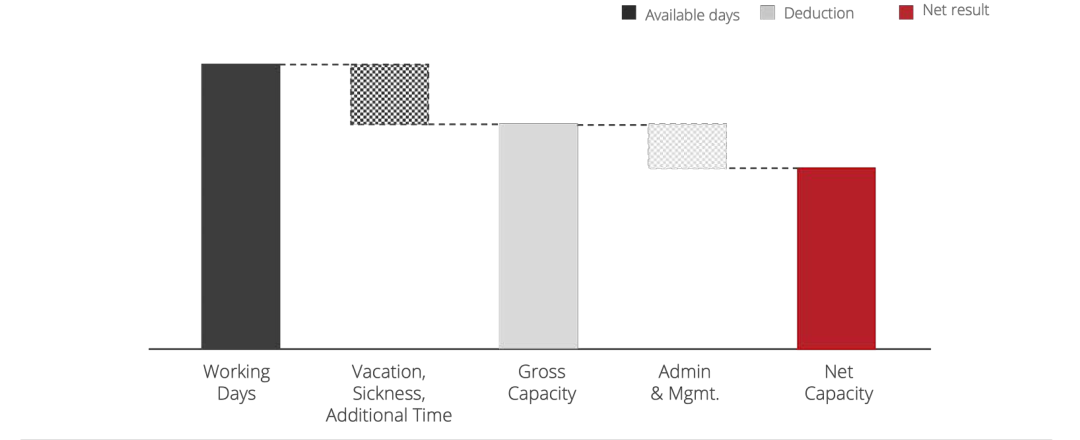
Of a typical employee's 250 working days, only around 200 are effectively available for project, service and demand work after accounting for absences, administration and management overhead.
1. More Realistic Planning and Better Control
Net capacity reflects true IT performance far more accurately than gross values. It is an annual average based on clear assumptions, can be updated in minutes, and stays current. Despite — or perhaps because of — its simplicity, it is surprisingly accurate and a powerful steering instrument for the overall portfolio.
2. Reliable Rates and Well-Founded Sourcing Decisions
A cost center's hourly rate is calculated by dividing annual personnel costs by the average annual net capacity. That yields reliable rates that help make informed build-or-buy decisions, identify unproductive activities, and improve overall cost efficiency.
3. Clarity on Organizational Capacity
By clearly assigning employees to organizational units, teams, and cost centers, you can see where capacity lies—and where it does not. This clarity is a prerequisite for any serious discussion of priorities, organizational structure, and transformation.
Example:
A team consists of ten employees on 40-hour contracts, including a team leader and two other employees with managerial responsibilities.
Instead of planning with a gross capacity of 400 hours per week, the team's realistic net capacity is around 320 to 360 hours.
Accounting for this gap is one of the key levers for avoiding overload, misallocation of priorities, and hidden overtime.

lightbulbExpert Tips:
1. Done is better than perfect
When setting adjustment factors — say, 3% for sick days or 15% for a team lead's leadership duties — it matters more to account for them at all than to calculate them perfectly on the first try. A pragmatic estimate is far more effective than months of discussions over percentage points.
2. Maintain net capacity annually, not operationally
Net capacity is intentionally an annual average. It is not suitable for day-to-day scheduling; its strength lies in strategic steering and decision-making.
3. Deliberately exclude leadership capacity from operational planning
Leadership capacity is critical for transformation, so it should not be committed to operational tasks. For example, setting a CIO's net capacity to zero is a deliberate and appropriate reflection of that reality.
Client Anecdote:
For a client in industrial manufacturing, a large IT service center was established abroad as part of the Bee360 implementation. A matrix organization emerged: Many IT employees were legally employed in offshore service centers and not on the local payroll, but functionally belonged to local IT teams.
Here, Bee360 became the single source of truth, clearly mapping which IT employee is assigned to which cost center and which team—information that is often not maintained in global HR systems.
This transparency proved essential for effective capacity and resource management, well-informed sourcing decisions, and reliable control of personnel costs.

"There is no final IT operating model—only continuous adaptation. Leadership, market conditions, technology shifts, and product lifecycles all influence when and how IT needs to adjust its approach."

Christian Popp
Vice President Digital, Grenke

2
RUN the Business: Service Structure and Service Planning – How Much Capacity Does Operations Consume?

"With Bee360, I can take the management and leadership of our IT department to a new level. Thanks to capacity management with Bee360, I know exactly how much time we need for services and Continuous Improvements. When it comes to demonstrating that IT is dedicating sufficient time to projects and prioritization becomes necessary, I can make my case with concrete facts. This strengthens our position and helps me drive IT initiatives forward while protecting my employees from burnout."

Christian Reinmann
CIO, Ypsomed
Navigation Analogy: Choosing the Right Level of Detail
A navigation map does not depict the world on a 1:1 scale; it deliberately simplifies things to make navigation possible. If you try to map every dirt road, you lose sight of the route. The same applies to IT operations: if you create a service for every application, you lose the big picture. A suitable service interface helps focus management efforts where they create real value.
Once we have established the real capacity of the IT organization, the next critical question becomes: How much capacity is already consumed by ongoing operations?
The Service Cut as a Management Foundation
To answer that question, we work with our clients to define a pragmatic service structure. In most organizations, the existing service catalog is far too granular for management purposes.
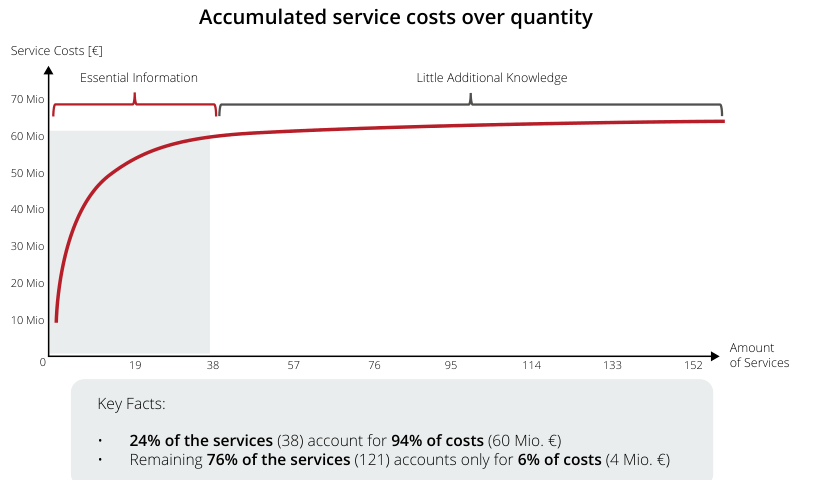
The figure shows a real-world example where 94% of costs are tied up in 24% of the services. It is fair to ask what is being measured in the remaining 76% of the services.
The service cut is neither an end in itself, nor an ITIL formality. It is a deliberately chosen tool to answer two core questions together:
- What does it cost to keep existing IT systems and processes running – with no new projects or demands?
- Are these costs justified or could business use cases be supported more efficiently?
From there, the capacity needed to run those services is planned in a way that's realistic, transparent, and decision-ready for management.
1. Securing Operations With Solid Decision-Making Data
By planning services, we create shared visibility into how much capacity is tied up in day-to-day operations — in practice, often up to 70% of available net capacity. This transparency is the prerequisite for reliably protecting operations and making decisions based on data rather than assumptions.
2. Protection Against Overload and Realistic Change Capacity
Together, we identify how much capacity is already committed to "business as usual". Overburdened teams and employees are identified early on, and the available scope for change initiatives is realistically assessed. This provides management with a solid foundation for honestly assessing the feasibility of new initiatives together with the executive board.
3. Comparability, Control, and Internal Cost Allocation
Standardized service planning enables benchmarking (especially for commodity services) and targeted identification of savings opportunities. It also creates a solid foundation for internal chargebacks and transparent communication of IT performance to stakeholders.
Curious How It Continues?
This guide brings together our practical expertise from over 20 years of advising CIOs and IT organizations — so we make sure it lands with the right people. In a short conversation, we'll place your situation together; afterward, you'll receive the complete copy of the guide. That way, you won't spend your reading time working through 40 pages without knowing what's relevant to you — instead, you'll read with focus on what actually matters for your organization.
Reality Check
Budgets that drift from plan. Capacity conflicts that only become visible once it's too late. Project delays you can't fully explain to the board. It usually doesn't feel like a problem — we'll show you why it probably is.
Case Studies from CIOs, for CIOs
How CIOs like Dr. Stefan Heizmann (Heidelberger Druckmaschinen) and Nora Legittimo (Marantec) actually put this into practice — including what didn't work on the first try and what they'd do differently today.
An Honest Look at Your Gaps
Which chapters will actually move you forward, and which might be too early for you right now? So your first read isn't spent on topics that don't fit your organization yet.

Emma Blewitt
Director UK, Bee360